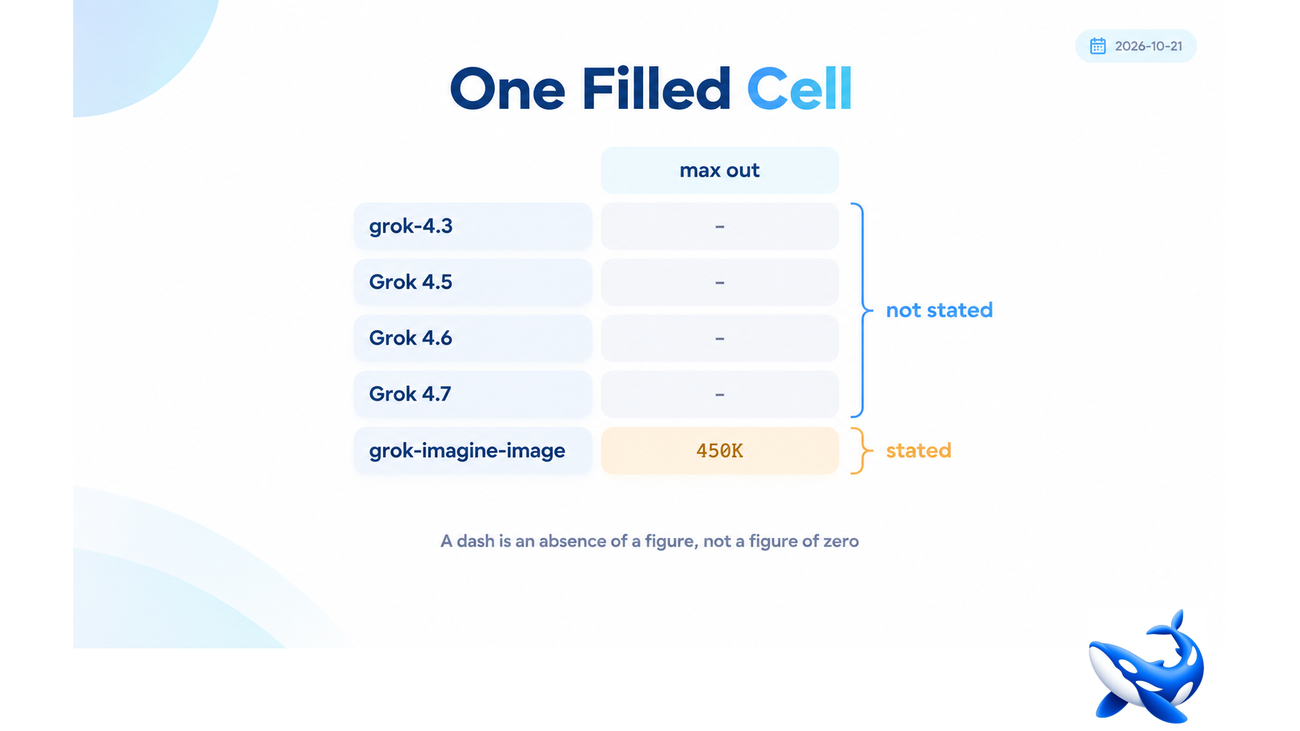
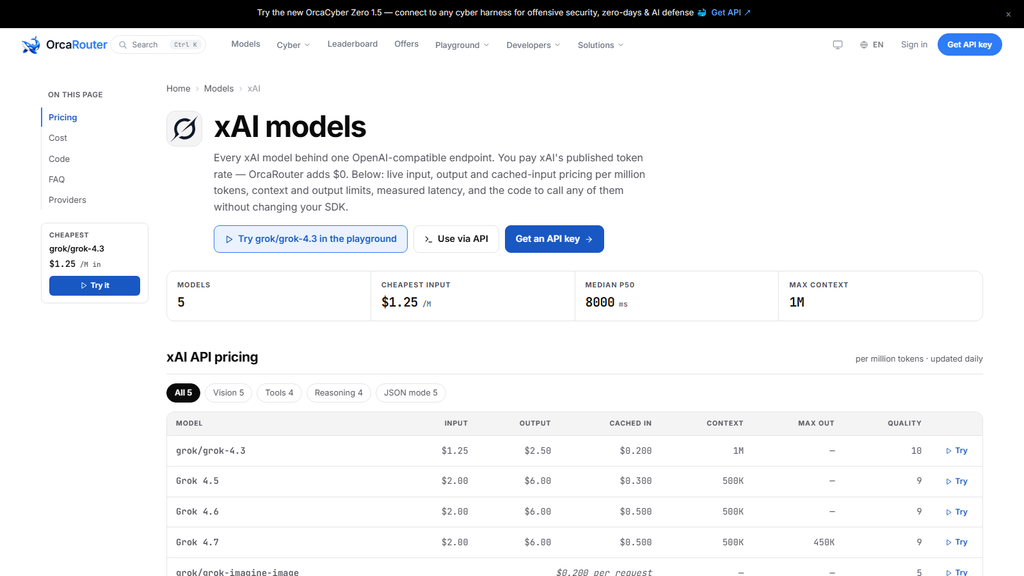
The max-output column on the OrcaRouter grok models page has five cells. Four of them contain a dash [OURS].
`grok/grok-4.3`, Grok 4.5 and Grok 4.6 leave the cell blank. Grok 4.7 fills it with 450K. The fifth row, `grok/grok-imagine-image`, is shaped differently from the moment it starts — its price is per request, its context cell is blank too, and the table’s own alignment shows the row is not a completion endpoint at all.
Four dashes is not a scandal. It is a very ordinary thing for a catalogue to do, and it is worth an article because of what people assume when they see it: that the dash is a small number, that it means “unlimited”, or that it can be ignored because it is not a rate. All three assumptions produce wrong plans, and this page is small enough to show exactly how.
The column, and what each value really is
| Row | Context | Max out | Input / output per 1M |
| `grok/grok-4.3` | 1M | — | $1.25 / $2.50 |
| Grok 4.5 | 500K | — | $2.00 / $6.00 |
| Grok 4.6 | 500K | — | $2.00 / $6.00 |
| Grok 4.7 | 500K | 450K | $2.00 / $6.00 |
| `grok/grok-imagine-image` | — | — | $0.200 per request |
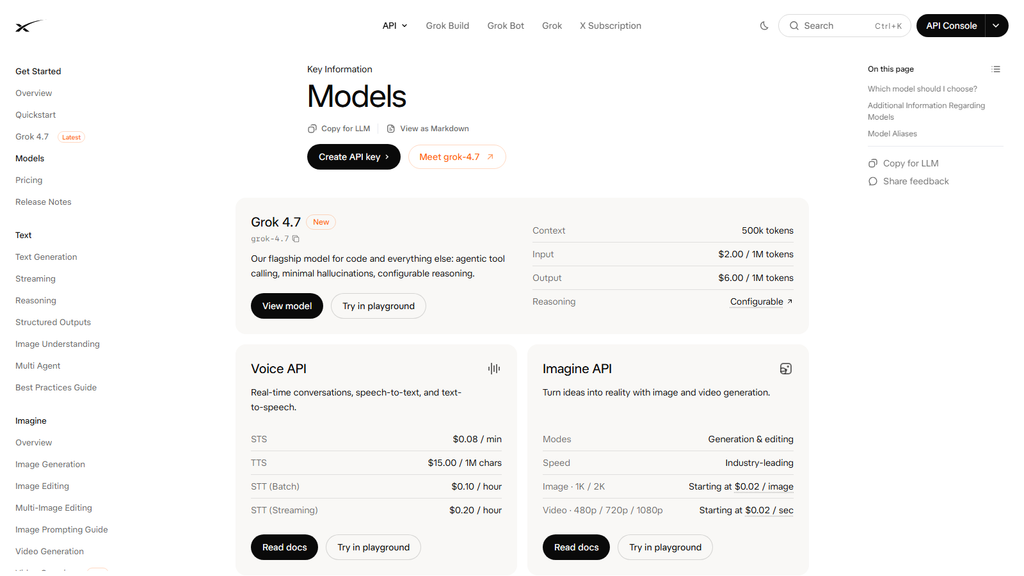
The rates are the provider’s published prices passed through with $0 markup [VENDOR]; the columns are our page data [OURS].
Two facts stand out from the filled row. The first is its size: 450K is a large output ceiling, larger than any row on the Anthropic catalogue (which caps at 128K) and larger than every OpenAI row (128K at the top). The second is its relationship to its own context window: 450K of 500K is 90 percent.
That ratio is the interesting part. A ceiling at 90 percent of the window means the row is willing to let a single completion consume nearly the entire budget, which is the same shape as the Kimi K2.7 Code row where the ceiling and the window are identical. It is a statement about intended use — long-form generation — rather than about a hard architectural limit.
What a dash could mean, and what it means here
There are at least four things a dash in this column can mean across catalogues, and telling them apart matters because only one of them is a limitation.
Not published. The provider states a ceiling in its own documentation but the catalogue does not carry it. The most common case by far.
Not applicable. The row is not the kind of endpoint that generates tokens — an image, a speech or an embedding model. This is what is happening on the fifth row.
Not yet measured. The row is new and the limit has not been verified or imported. This produces a dash that will later become a number.
No separate limit. The output is bounded only by the context window. Rare, but it is the reading that the K2.7 Code row makes plausible by stating both numbers and letting them coincide.
None of the four is “zero”, and that is the important part. A data pipeline that maps a dash to zero will size every chunk at zero and every retry at zero, and will look like it is working until the first long generation hits whatever the real limit is. On this page, three of the four text rows have no stated ceiling at all, so a planner built on this table has nothing to plan with for three quarters of the catalogue.
The honest handling is the one the table supports: treat a dash as unknown, fall back to the context window as a hard upper bound — a response cannot exceed the window it shares with its prompt — and note that the true ceiling is somewhere at or below it.
The 500K cliff next to the blanks
The context column carries a second, more consequential absence, and it is easy to miss because every cell in it is filled.
`grok/grok-4.3` carries a 1M context window. Grok 4.5, 4.6 and 4.7 all carry 500K [OURS]. The window halves between the old row and the three newer ones, and it stays halved.
That is a shape worth naming because it runs against the direction of the market. Most catalogues widen windows over time; this one narrows them at the generation boundary and leaves the newest rows at half the old ceiling. The practical effect is that a workload sized against grok-4.3’s window will not fit on 4.5, 4.6 or 4.7, and the rate card gives no hint — all four rows are priced within a factor of 1.6 on input.
There is a second-order consequence for the output column. If the ceiling on a response is unknown but the window is 500K, then the true output ceiling is somewhere between zero and 500K, and Grok 4.7’s stated 450K tells you where in that band the vendor is comfortable. That is the practical value of a single filled cell: it calibrates what the four dashes above it probably mean.
Why the flagship sits at the bottom of the ladder
The price column on this page inverts the usual ordering in a way that bears directly on how the blanks should be read.
`grok/grok-4.3` is $1.25 in and $2.50 out — the cheapest paid row — and it is also the row with the highest quality score on the page, 10 of 10, and the only row with a 1M window [OURS]. The three newer rows all list $2.00 and $6.00 and all score 9.
So the row with the least documentation in the output column is also the row the page ranks highest and prices lowest. The newest rows, which fill in the output ceiling, are the ones that cost more and score lower.
That is not a contradiction; it is a reminder that these are different columns measuring different things, and a catalogue is not obliged to make price, window and capability move together. But it does mean that a reader who assumes the newest row is the most capable one will pick the wrong model on this page twice over: worse on the stated score, worse on the window, and more expensive on both rate lines.
The one number that is reliable on every row
There is a column on this page with no blanks at all, and it is the one that decides most budgets: the input and output rates.
Every text row carries both. $1.25 and $2.50; $2.00 and $6.00 three times over. The image row’s price is per request and its cells are shaped for a different unit. So the pricing information is complete even where the envelope is not.
That asymmetry is normal and worth internalising: rate cards are usually complete and envelopes usually are not. A provider has every commercial reason to state a price and much less reason to state a limit, because a limit is a commitment and a price is an offer. When you plan against a catalogue, expect to fill the envelope columns yourself, from documentation, from a test call, or from a conservative assumption about the window.
For this page, the conservative assumption is easy to state: the output ceiling is at most the context window, so 1M on grok-4.3 and 500K on the other three, and Grok 4.7’s stated 450K suggests the rest are comfortable well above a typical generation length.
How to read a catalogue with blanks
Four rules that generalise past this provider.
Map a dash to unknown, never to zero. A zero output ceiling is not a product anyone sells. A dash is an absence of a figure and deserves its own sentinel in any schema.
Separate structural blanks from unpublished ones. An image row has no context window because it has no context. A text row with a blank ceiling has an unpublished number. The two look identical in a parsed table and mean completely different things.
Use the widest stated value on the page to calibrate the blanks. One row stating 450K tells you the family is comfortable with large outputs. That is inference, not data, and it is better than assuming zero.
Never rank rows on a column that is mostly empty. Three of four text rows have nothing in the max-output column. A sort on it will order the catalogue by whether the field happens to be filled, which is a fact about documentation rather than about models.
A column of dashes is a column of questions, and the useful thing about a four-row catalogue is that you can see the whole set of them at once — plus the one filled cell that tells you what the answers probably are.
Sourcing note: every context window, max-output value and rate in this article is read from the OrcaRouter Grok provider page on 2026-10-21. The rates are the provider’s published prices passed through with $0 markup [VENDOR]; the row structure, the blank-column counts and the cross-row comparisons are ours [OURS]. The 0-to-10 quality scores are our own composite, not a third-party benchmark. The four readings of a dash are our own analysis of catalogue conventions, not a claim about this provider’s intent. No third-party evaluation figures are used. Rates and limits change; all values checked 2026-10-21.
